The 2026 State of Developer Adoption: AI is shipping faster than developers can adopt. Here's what's working

Developer adoption and engagement have become a central function for software vendors seeking to drive growth. How well an organization attracts, onboards, enables, and retains developers often determines whether a product takes hold or stalls after evaluation.
In this report, we examine how organizations approach developer adoption and engagement today: what they do, what gets in the way, and how they measure progress.
The first chapter looks at which practices organizations currently use, how practitioners rate their effectiveness, and the main barriers they face. The second shifts to hands-on experiences: where they add unique value, what makes them effective, and how organizations plan to invest. From there, the third chapter turns to measurement, covering time-to-productivity, training completion rates, other tracked metrics, and the systems organizations connect to their engagement activities. The fourth chapter explores how extensively organizations use AI for developer engagement, which use cases lead today, and how practitioners assess its impact. The last chapter covers community, comparing different initiatives and how structured and peer-to-peer learning perform across content types.
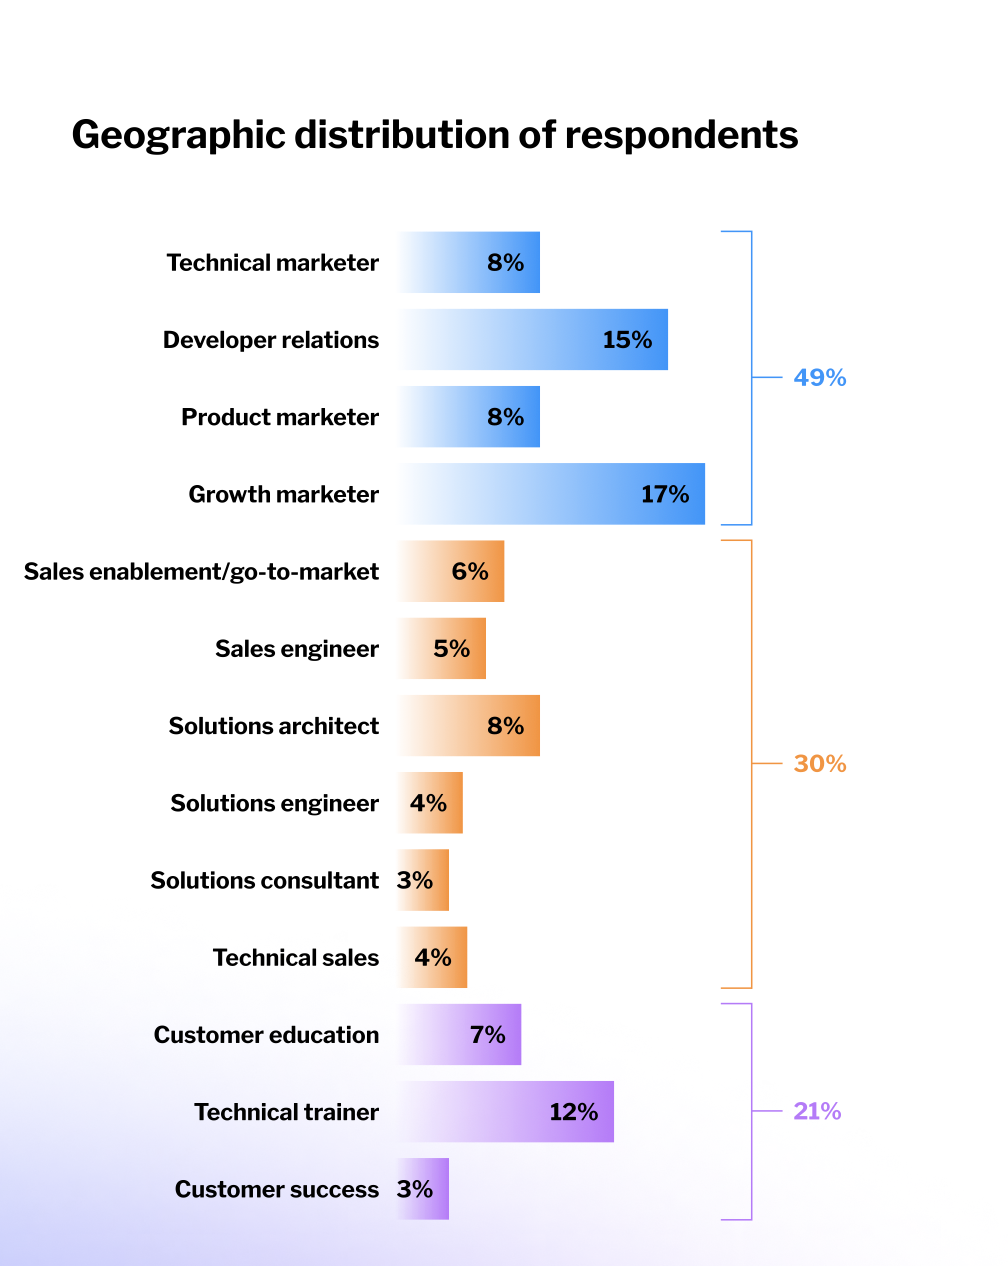
The findings are based on data collected from an online survey designed, hosted, and fielded by SlashData in March 2026. The survey reached 424 professionals in North America working in marketing, sales, and developer education roles at software companies. Throughout the report, these respondents are referred to as “practitioners.” For an overview of the survey methodology, see the “Methodology” section at the end of this report.
Chapter 1 → Current adoption practices and challenges
Practices used and perceived effectiveness
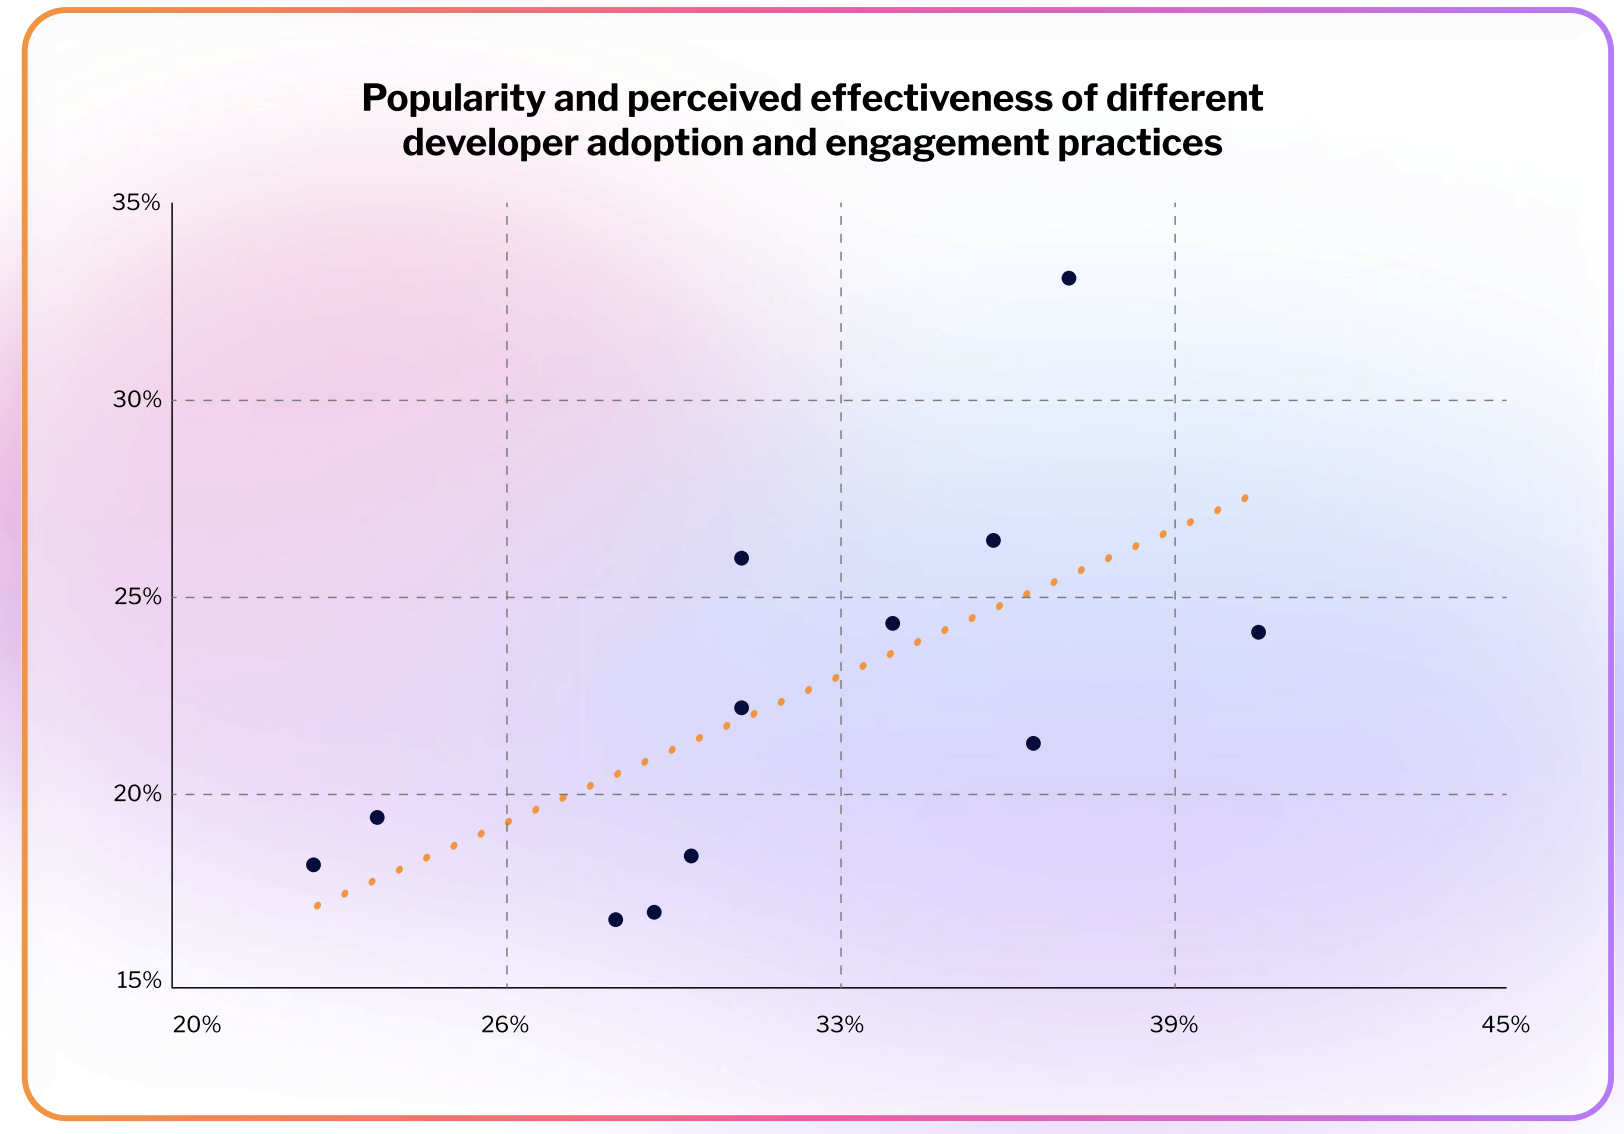
Practitioners were asked which developer adoption practices their organizations currently use and which three they consider most effective. Popularity and perceived effectiveness are positively correlated: organizations are, broadly, putting resources into practices they find valuable. However, some practices sit noticeably above or below the trend line, and these deviations might point to where strategies may be misallocated.
Developer community spaces receive the highest effectiveness rating of any practice in the survey, with one in three practitioners ranking them among their top three. Yet adoption sits at roughly the same level as video tutorials. This gap likely reflects the organizational effort required to build and sustain a community, rather than doubts about its value. Communities create persistent, peer-driven spaces where developers support each other over time, something transactional formats cannot replicate. Proofs of concept (POCs) are also rated more effective than their adoption levels would suggest, pointing to underutilization relative to their reported impact.
Written documentation is the most widely used practice but falls below the trend line on effectiveness. Developers rely on it, yet treating documentation as a primary driver of adoption might limit results. Video tutorials tell a related story: high usage, with effectiveness that trails hands-on formats such as technical demos or interactive labs. Both are supporting assets, and, as such, practitioners should pair them with higher-impact experiential formats rather than leaning on them alone.
Worth noting is that the perceived effectiveness of different practices varies by job function. Among respondents working in marketing, 40% include community spaces in their top three, the highest share of any group. This drops to 29% among those in education and to 25% among sales, who rate technical demos (31%), proofs of concept (30%), and interactive labs (30%) as the most effective practices. These gaps reflect different priorities, and when teams disagree on what works, developer adoption and engagement strategies risk fragmentation.
Main barriers to developer adoption and engagement
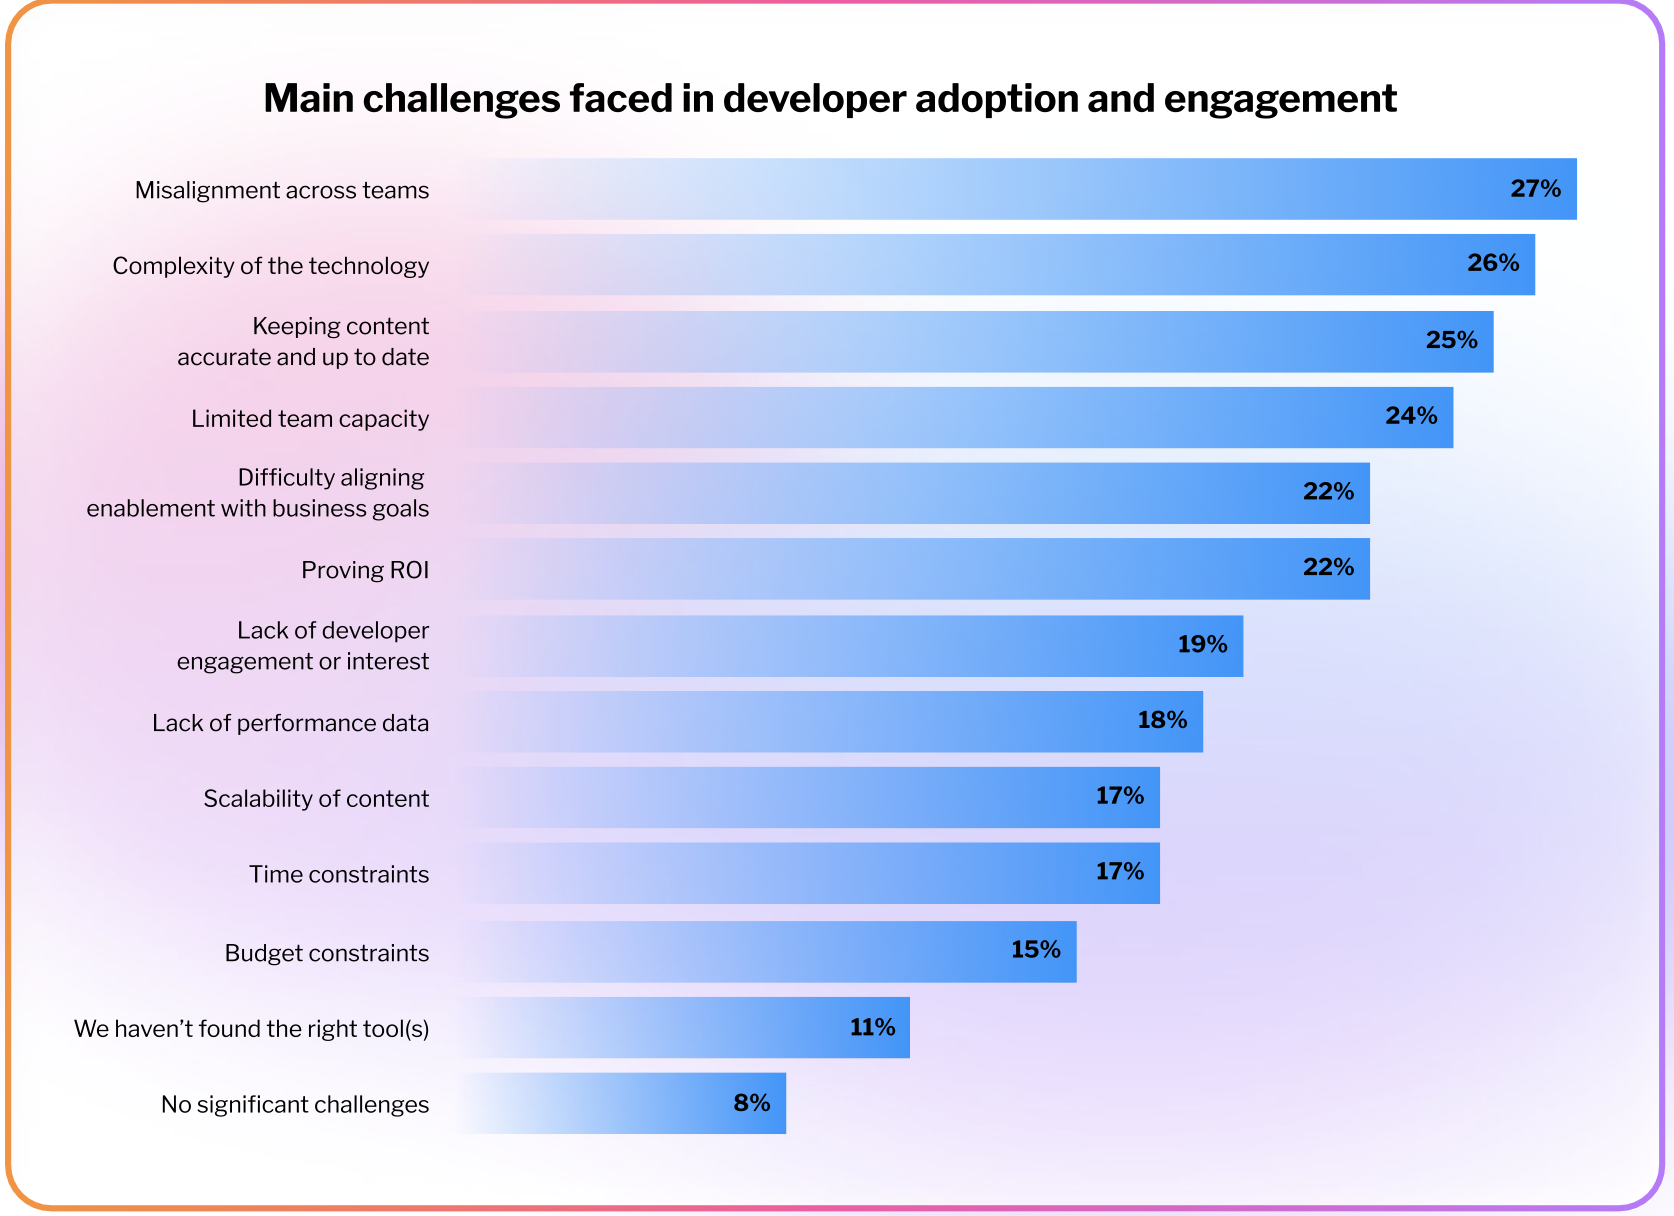
Selecting the right practices matters, but execution brings its own set of challenges. The vast majority (92%) of practitioners report facing at least one significant challenge, with no single obstacle dominating. The top four responses sit within three percentage points of each other, pointing to a cluster of interconnected barriers rather than one clear bottleneck.
Misalignment across teams ranks as the most cited challenge, reported by 27% of practitioners. This connects directly to the pattern visible in the effectiveness data: when different functions disagree on which practices work, coordination suffers, and strategy fragments. Companies should treat internal alignment on developer adoption and engagement as a core operational priority, with shared definitions of success across marketing, sales, education, and product.
Technology complexity follows at 26%, reflecting the difficulty of enabling adoption for products that require significant technical depth to evaluate. Keeping content accurate and up to date (25%) and limited team capacity (24%) round out the top four. Together, these point to teams that are stretched thin across too many formats and channels. However, budget constraints rank near the bottom of the list, cited by just 15% of practitioners, highlighting that the top barriers are about coordination and capacity, not funding. More budget can help with increasing the headcount, but it cannot fix misaligned teams or simplify a complex product.
Chapter 2 → Hands-on experiences
Where hands-on adds unique value
The previous chapter identified hands-on experiences, such as interactive labs, among the top-ranked tools for driving developer adoption. But effectiveness ratings alone do not explain where these formats deliver unique value.
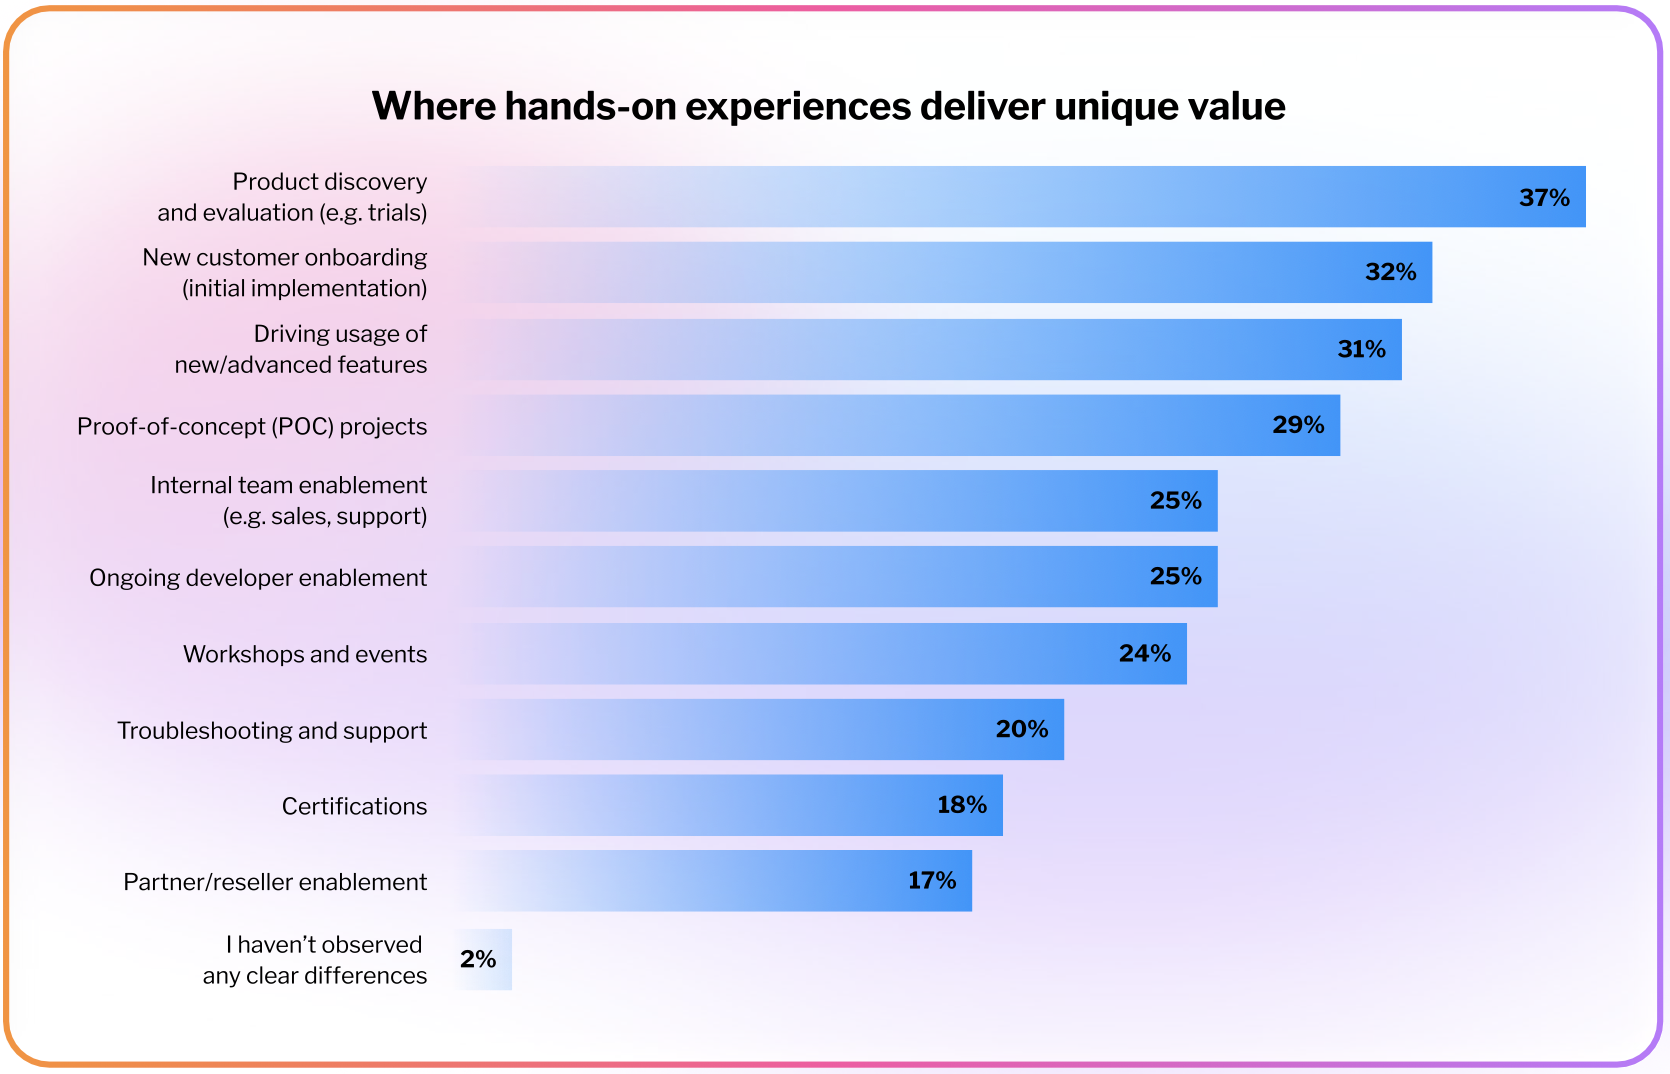
When asked where hands-on learning experiences are most uniquely valuable, only 2% of practitioners reported observing no clear differences compared to other formats, indicating broad agreement that these experiences serve a distinct function in the adoption toolkit.
The top use case, product discovery and evaluation (37%), reflects the role hands-on experiences play early in the developer journey, where direct product interaction might support evaluation more effectively than documentation or marketing materials. New customer onboarding (32%) and driving usage of new or advanced features (31%) follow closely, suggesting that the utility of these experiences extends across the customer lifecycle rather than being concentrated at a single stage.
Interestingly, among practitioners using hands-on labs, nearly two-thirds (63%) report that developers are fully productive within two months or less, compared to 42% who do not. This gap suggests hands-on formats may support faster time-to-value, reinforcing the perceived effectiveness of hands-on experiences in onboarding. This is a critical stage of the developer journey, where early momentum can also directly affect long-term retention and engagement.
Characteristics of effective hands-on experiences
The value of hands-on experiences is clear. But what specific characteristics should an effective hands-on experience have, and how do priorities differ across teams?
The top three characteristics, production-like environments (31%), goal-oriented challenges (30%), and integration with real tools and APIs (28%), point to two related priorities: realism and purpose. Developers want experiences that mirror actual working conditions, built around clear objectives rather than open-ended exploration. Realistic data (25%) reinforces the fidelity theme. For platform vendors designing hands-on experiences, combining authentic environments with structured, goal-driven tasks is the clearest design direction.
Among sales practitioners, the authenticity characteristics are even more pronounced. Production-like environments (39%) and real tools and APIs (37%) both rank considerably higher than the overall average. When hands-on experiences are used in a pre-sales or evaluation context, fidelity to real-world conditions is a requirement. As such, a prospect’s confidence in a product might depend on how convincingly it can be demonstrated.
Education practitioners, on the other hand, show a notably different profile. Immediate feedback (31%) and integrated AI assistance (26%) are the top two features for this group, both characteristics that support the learning process itself. This shows that a single design template is unlikely to serve all contexts equally well. Sales-facing experiences should optimize for realism, while education-facing ones should prioritize guided progression and immediate feedback and assistance to keep developers engaged.

Sentiment towards investment in hands-on experiences
Given the value that practitioners attribute to hands-on experiences, how likely are organizations to invest further?
Stated investment intentions for interactive labs are notably strong. Over nine in ten (92%) practitioners indicate their organizations are somewhat or very likely to invest in interactive labs platforms for external developer engagement in the next 12 months. However, stated intent and committed action are not equivalent.* Whether these plans translate into allocated budget within the stated timeframe will depend on factors such as organizational priorities and team capacity (one of the main challenges identified earlier). The finding is best read as a directional signal of where the field is heading rather than a confirmed forecast and shows that hands-on experiences face no meaningful resistance within organizations.
Among the minority who expressed uncertainty or unlikely investment intentions,** maintenance efforts (keeping labs up to date) ranks as the top concern (33%), followed closely by cost (30%). Together, these reflect that while organizations recognize the value of hands-on experiences, they remain mindful of the ongoing investment required to sustain them. Technical complexity and security or compliance concerns (both 27%) point to implementation friction as another key barrier. Unclear ROI and lack of executive buy-in rank lower (both 21%), suggesting that the case for interactive labs is generally understood. The obstacles are more about execution than justification.

Chapter 3 → Measuring developer adoption
Time to full product adoption
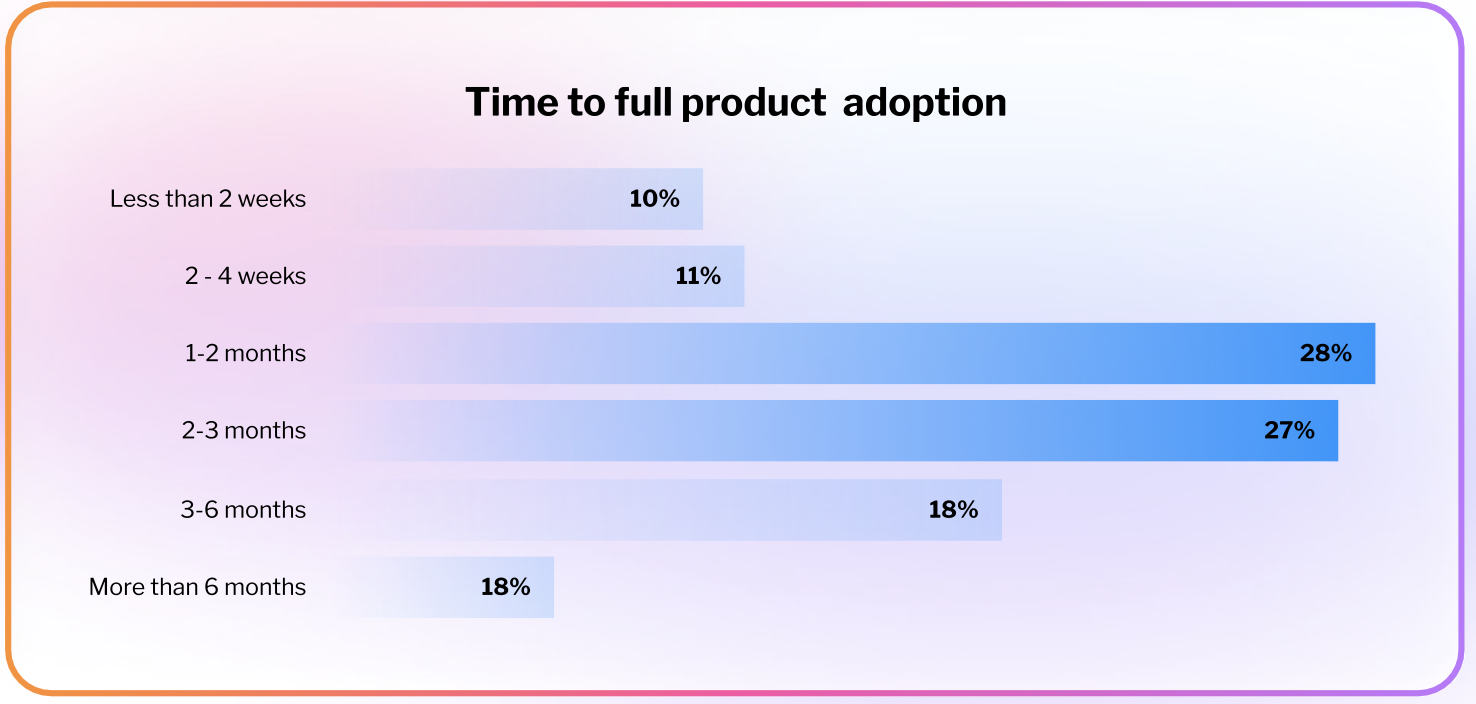
The majority of practitioners (55%) report that it takes between one and three months for developers to fully adopt and use their software products effectively, with nearly equal shares citing one to two months (28%) and two to three months (27%). Around a fifth (21%) report timelines under a month, suggesting relatively straightforward and efficient onboarding in those cases.
On the longer end, nearly a quarter of practitioners report extended adoption timelines: 18% cite three to six months, and 6% indicate the process stretches beyond six months. These longer trajectories likely reflect greater product complexity or more demanding integration requirements. As such, vendors selling these products shouldn’t necessarily treat a three-to-six-month adoption window as a red flag. The question is not how to eliminate that timeline but how to keep developers engaged through it.
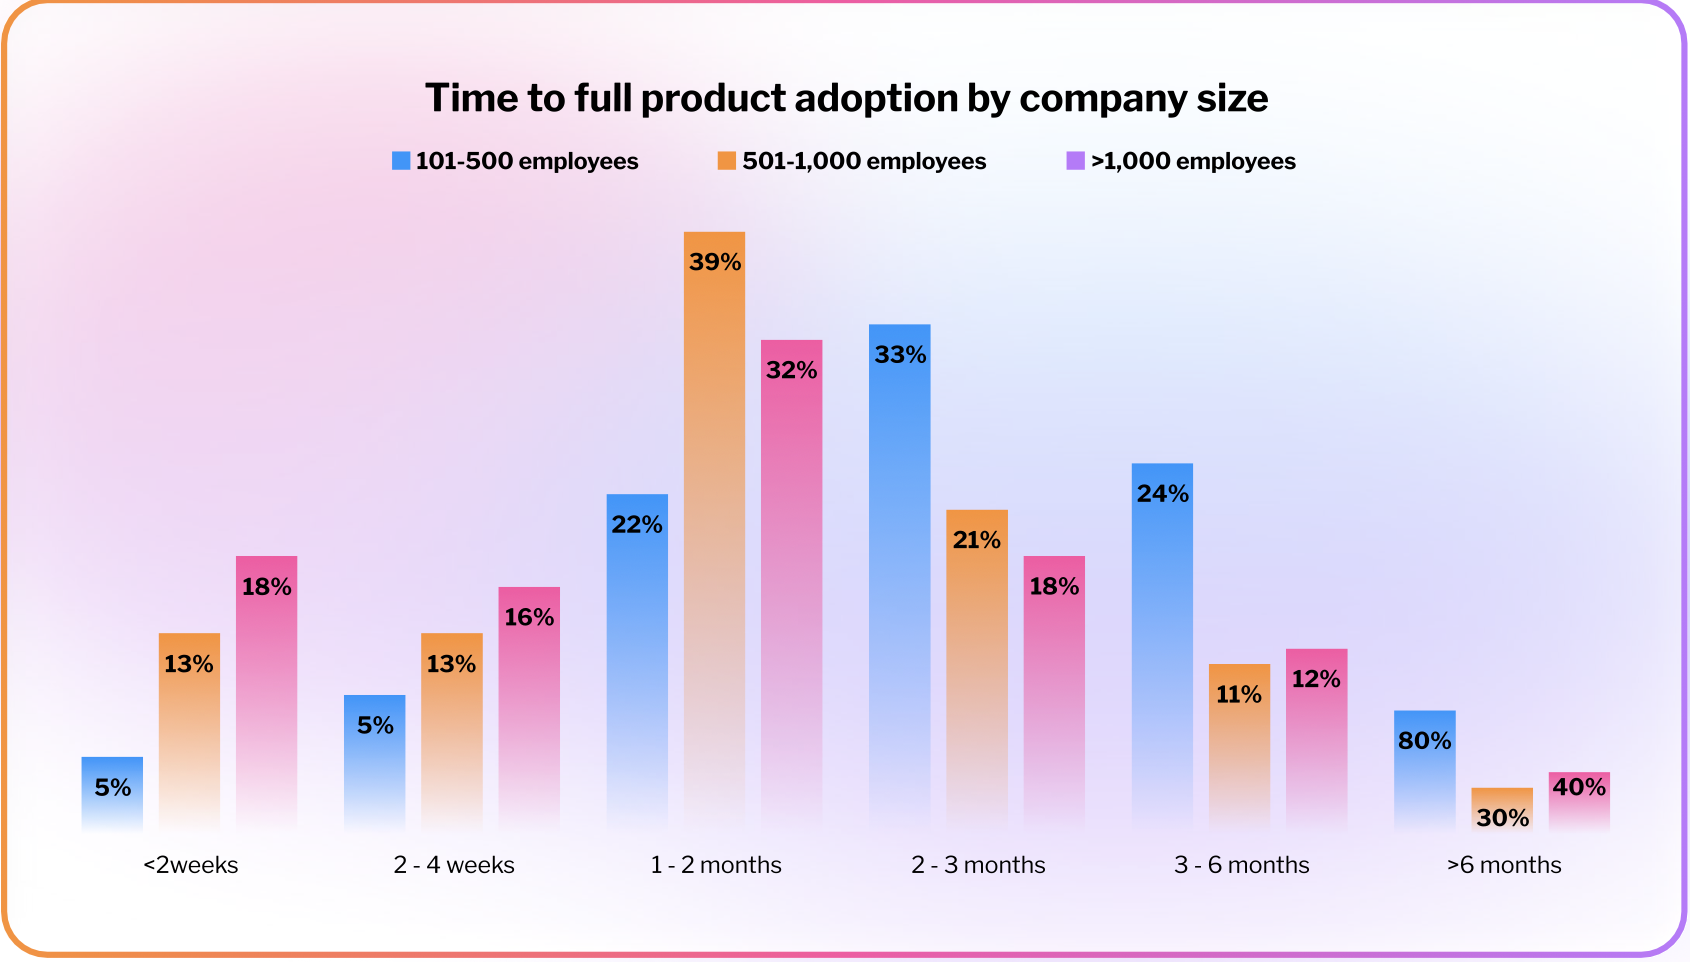
Adoption timelines differ markedly depending on the size of the vendor organization. Among practitioners at smaller companies (101–500 employees), 65% report that developers typically take more than two months to reach full adoption of their software. At organizations with more than 500 employees, that figure drops to 35%.
This gap likely reflects differences in resource availability and investment in developer enablement. Practitioners in larger organizations report using an average of 4.5 adoption practices, compared to 3.2 among those with 101–500 employees. The correlation between practice diversity and adoption is difficult to establish from this data alone. However, a more diversified strategy accommodates different learning styles, experience levels, and use cases. Organizations that offer developers a more varied set of resources and touchpoints, allowing them to find the right format at each stage of their journey, might be better positioned to reduce time-to-effectiveness.
Greater resources may enable not just a broader range of practices but deeper investment in each one. Among practitioners at the largest organizations (over 1,000 employees), around a third (34%) report onboarding developers in under a month, compared to 26% among those at mid-sized organizations (501–1,000 employees), who report a similar average number of practices
Training completion rates
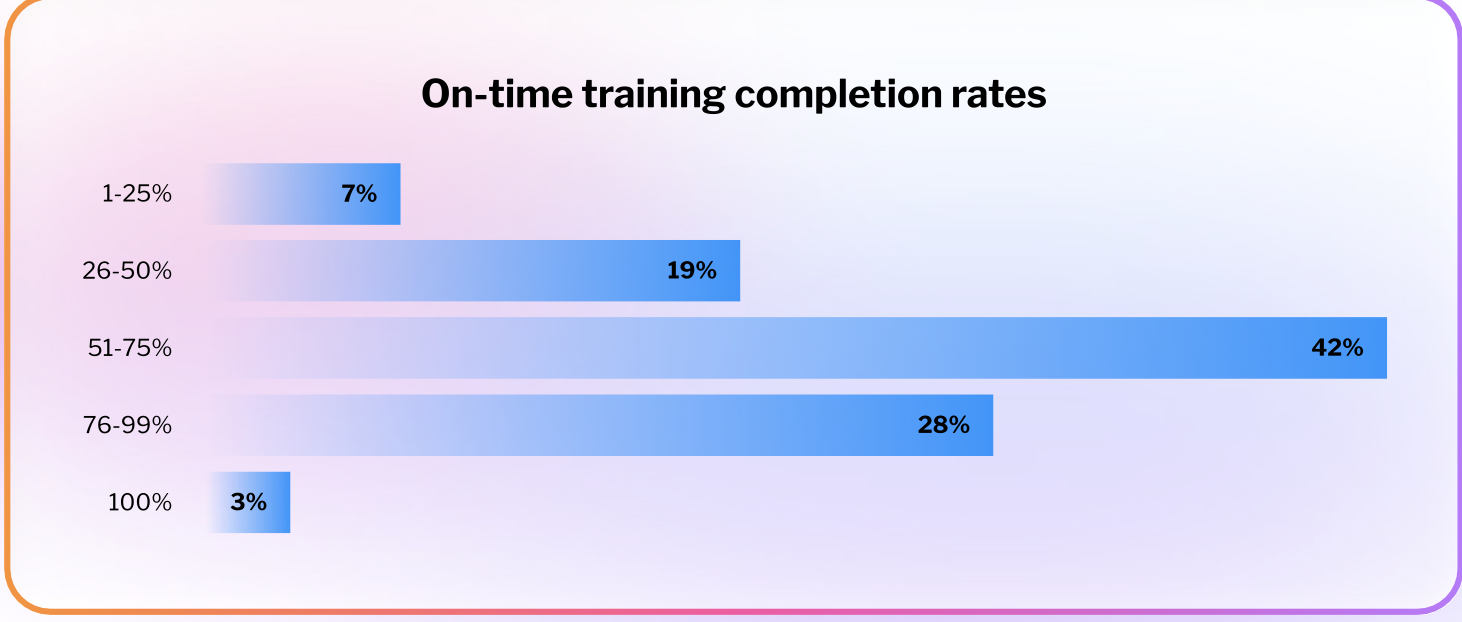
When asked what percentage of developers complete structured training offerings within the expected timeframe, responses cluster in the mid-to-high range. 42% of practitioners report that between 51% and 75% of developers complete their training on time. A further 28% report rates between 76% and 99%, while only 3% report full on-time completion across their developer base.
Notably, training completion rates don’t show a correlation with the adoption timelines reported in the previous section. This suggests that finishing structured training on schedule and reaching effective product use are, to a meaningful degree, independent outcomes. Developers may reach full adoption through informal learning paths, peer support, or direct product experimentation, regardless of whether they complete formal training programs within the expected window.
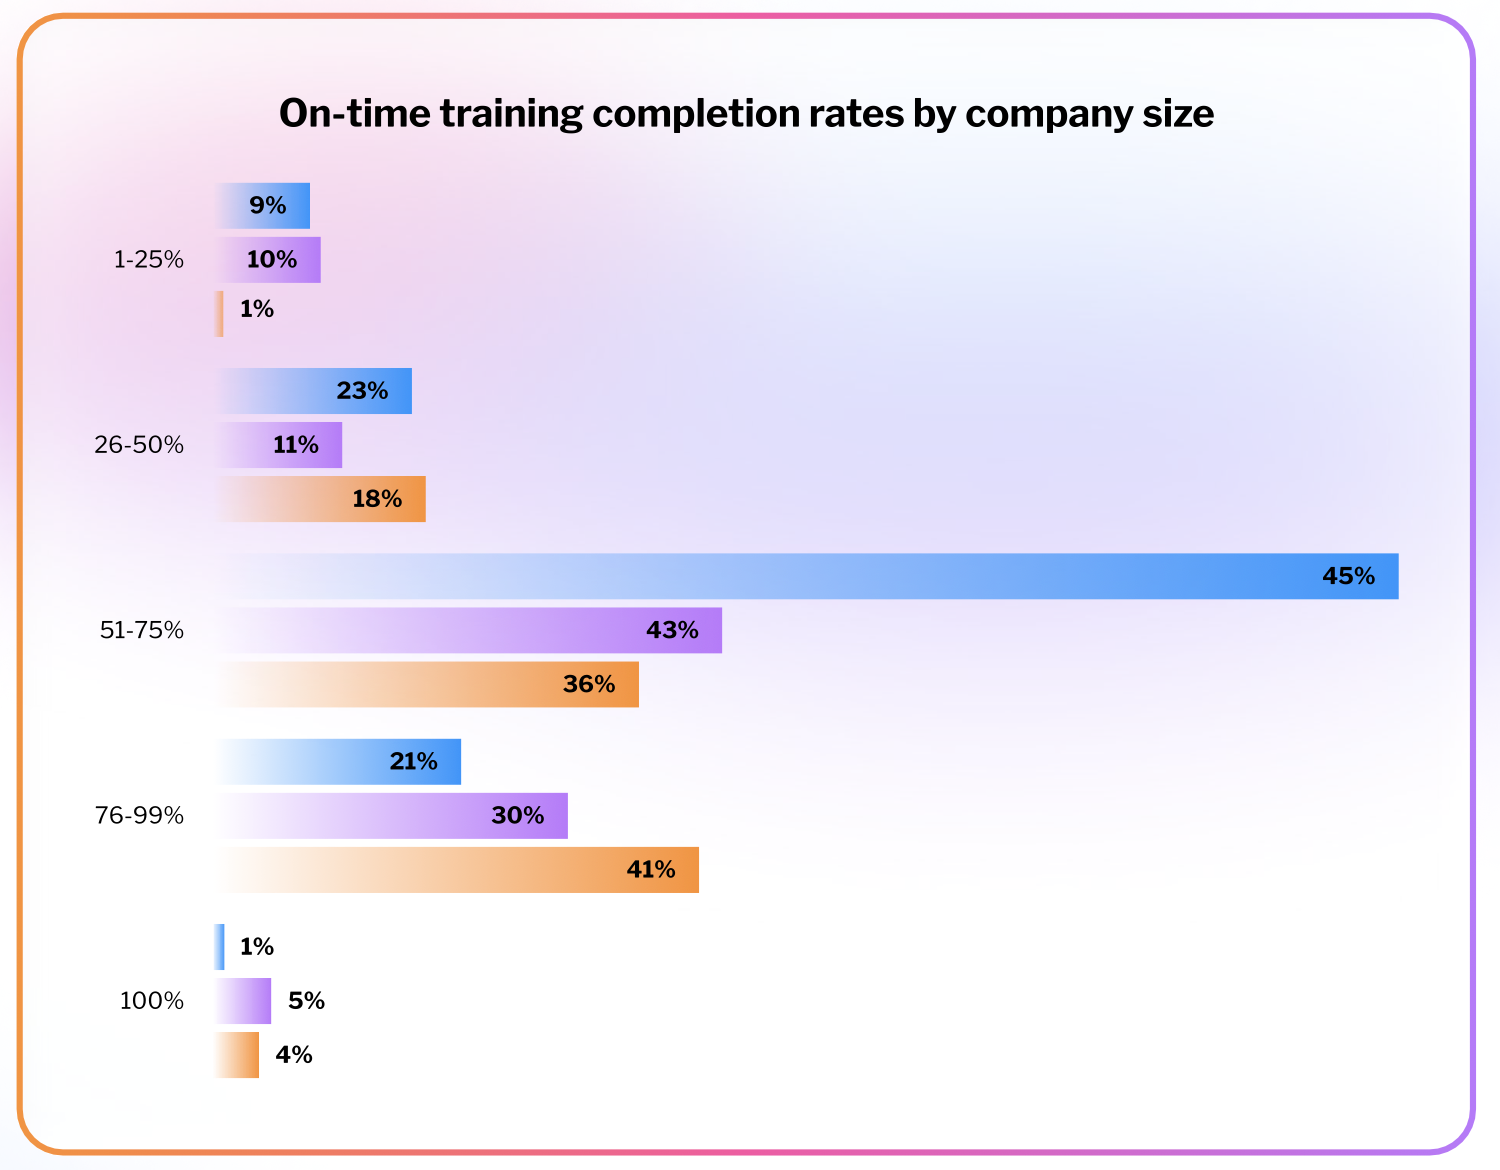
The size of the vendor company practitioners work for again introduces variation. Among practitioners at smaller organizations (101–500 employees), 67% report that more than half of their developers complete training on time, compared to 77% and 81% among practitioners at organizations with 501–1,000 employees and over 1,000 employees, respectively.
This pattern is consistent with the broader picture emerging across the report: practitioners at smaller organizations, operating with fewer resources and a narrower set of adoption and engagement practices, tend to see more friction across multiple dimensions of the developer journey. The gap is unlikely to reflect differences in developer capability or product complexity and more likely points to structural differences in the maturity and resourcing of enablement programs.

Metrics used to track developer adoption and engagement
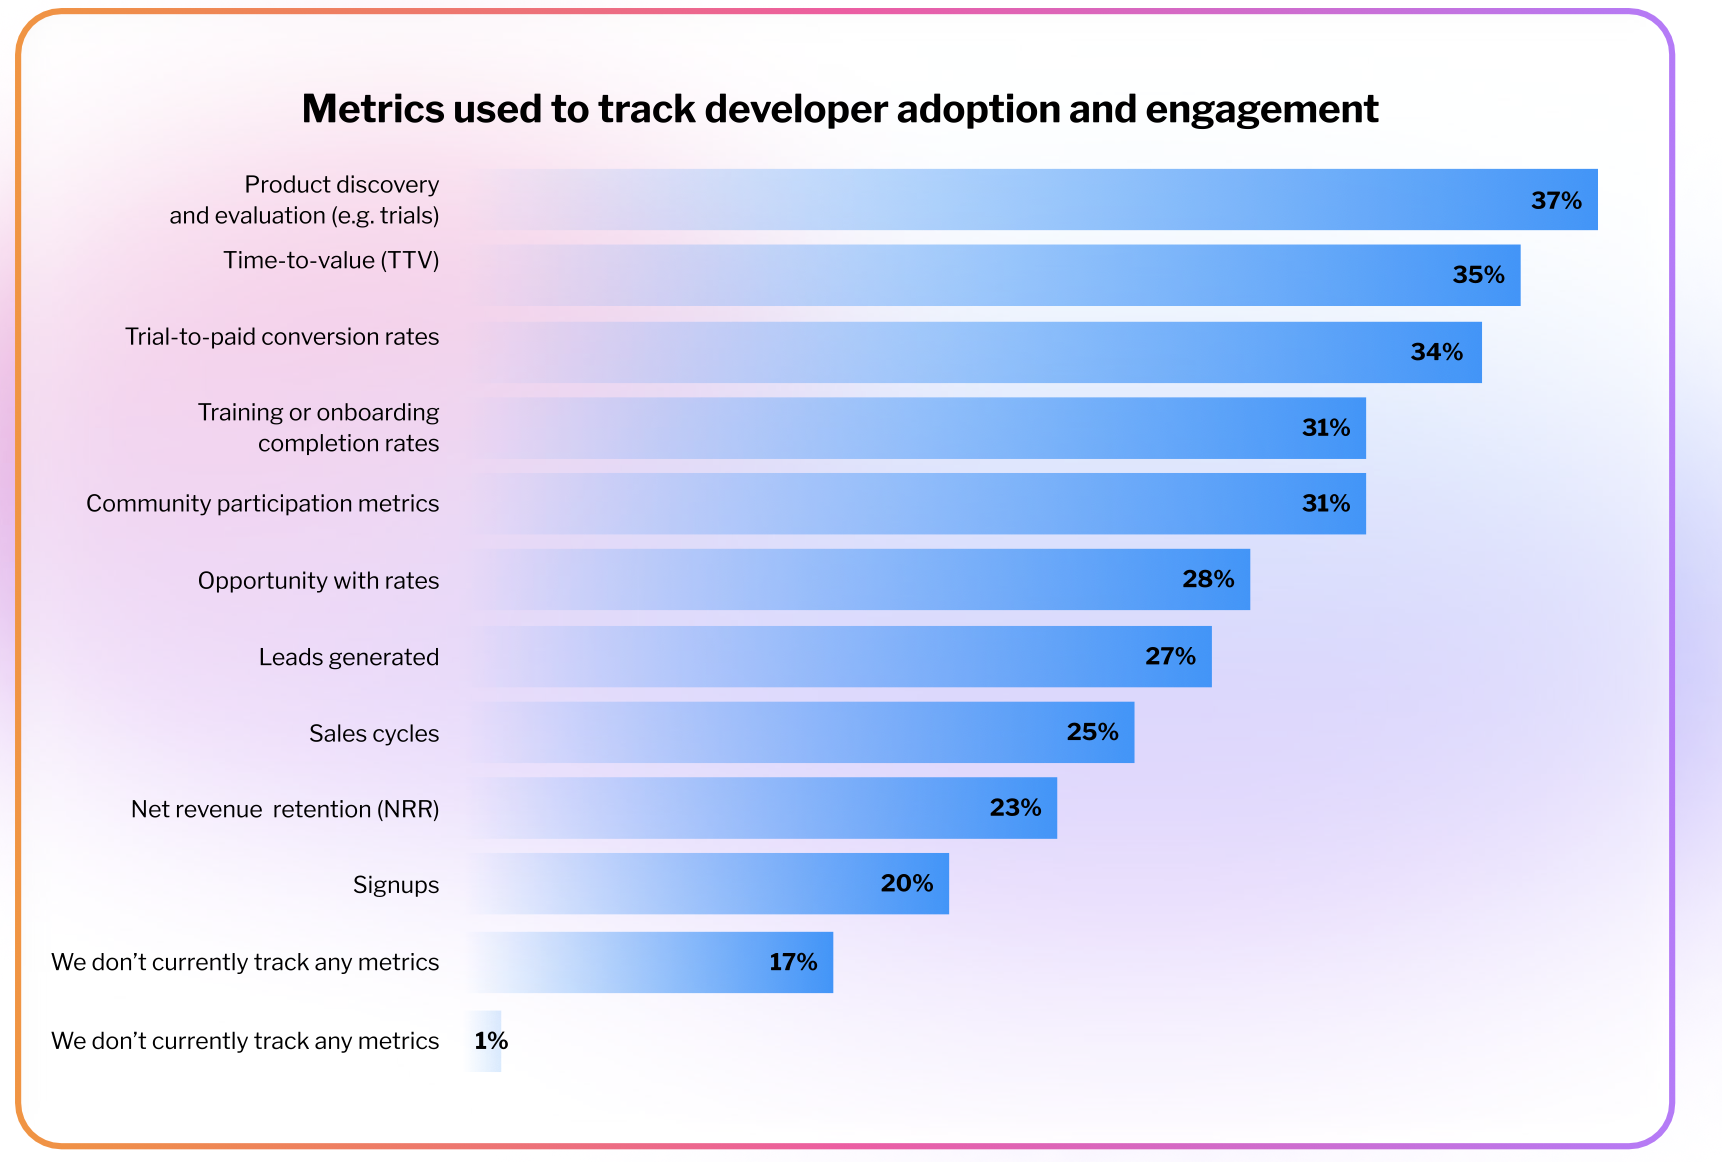
Beyond timelines and completion rates, how do organizations gauge whether their developer adoption and engagement efforts are paying off? Developer satisfaction scores top the list, cited by 37% of practitioners, followed closely by product usage rates (35%) and time-to-value (34%). Tracked indicators span the full developer journey, from top-of-funnel signals like leads generated (25%) and signups (17%), through conversion metrics like trial-to-paid rates (31%), to retention indicators like net revenue retention (20%). Monthly (54%) and quarterly (20%) review cycles are the most common cadence, and only 1% of practitioners report tracking no metrics at all.
The prominence of time-to-value as a top-three metric suggests that as organizations invest more in onboarding and hands-on experiences, the speed with which developers reach effective product use becomes a more actively monitored outcome. The relatively strong showing of community participation metrics (28%) links back to the earlier finding on the effectiveness of community spaces. Organizations that invest in communities are building the measurement infrastructure to track their impact.
Systems connected to engagement and training
How organizations wire their developer adoption and engagement activities into the broader technology stack says a lot about how they position the function. The data shows that organizations are connecting these activities to several platforms, with only 1% reporting no integration at all.
CRM platforms (49%) and learning management systems (44%) sit at the top, a pairing consistent with the dual commercial and educational nature of developer adoption work. These metrics give sales teams visibility into where a developer sits in their journey and give learning teams a way to measure whether their content is actually working.
Support and help desk systems (38%), customer success platforms (38%), and survey or feedback tools (37%) complete the top five. Top metrics like time-to-value, product usage rates, and satisfaction scores feed directly into renewal and expansion conversations, giving customer success teams a concrete basis for identifying at-risk accounts and upsell opportunities. The same metrics add context for support teams. Knowing whether a developer filing a ticket has completed onboarding, how actively they use the product, or how they scored on satisfaction helps agents distinguish between a product issue and an enablement gap.
A third (33%) of organizations connect AI/ML platforms to their developer engagement activities, which positions it among the least common integrations, though not by a wide margin. As organizations apply data and automation more broadly to their engagement programs, this share is likely to grow. Many are already planning to use AI for personalization, as the next chapter explores.
Chapter 4 → AI in developer engagement
Extent and direction of AI usage
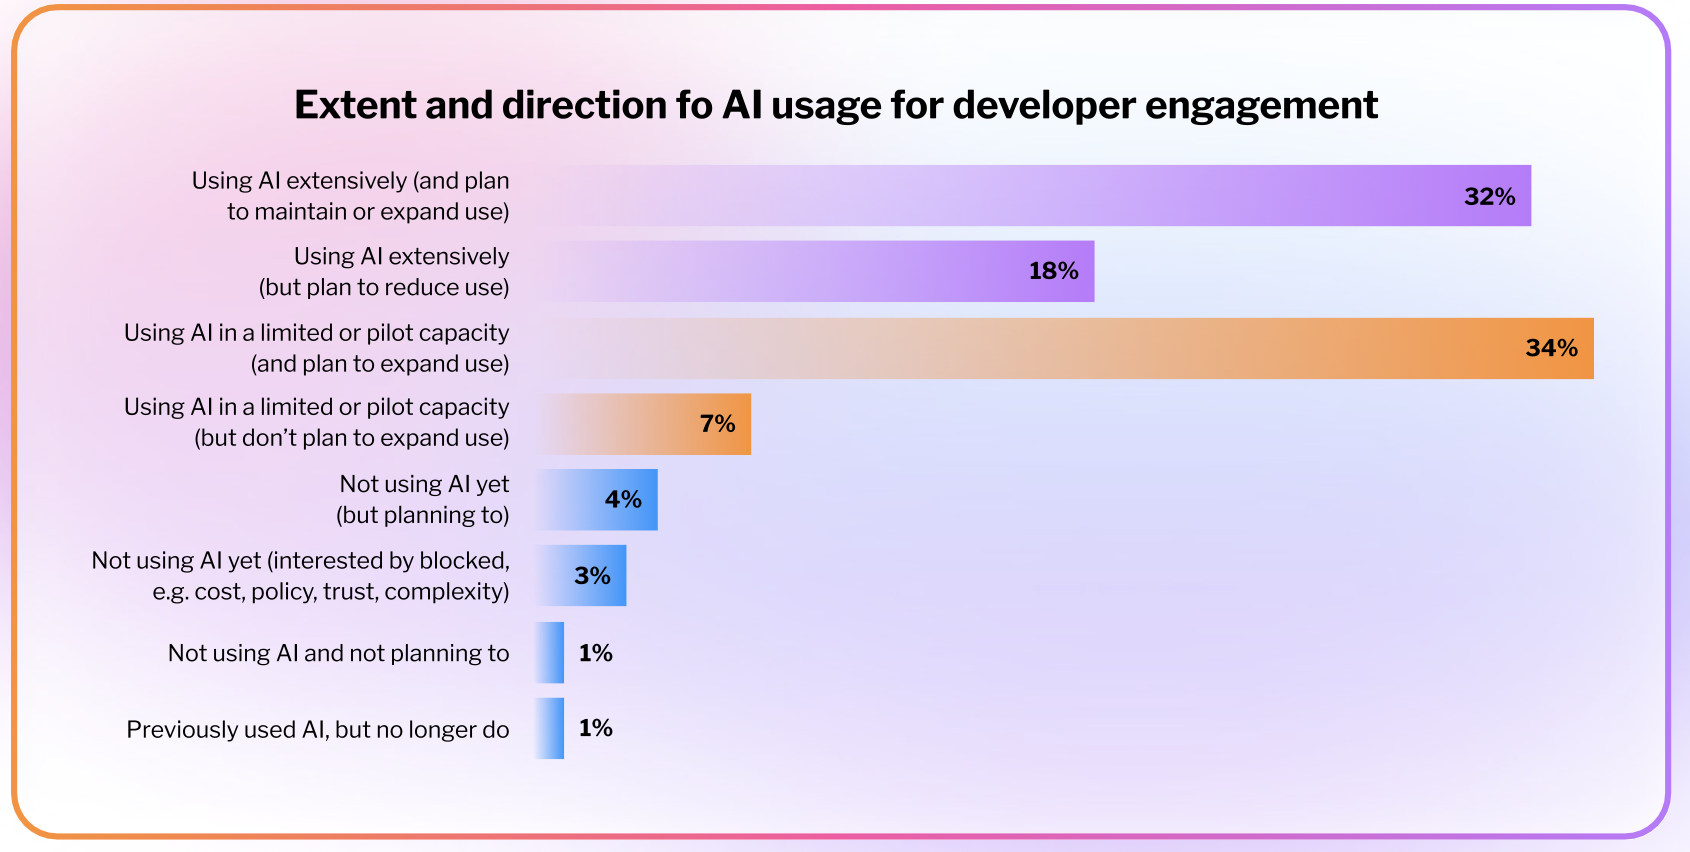
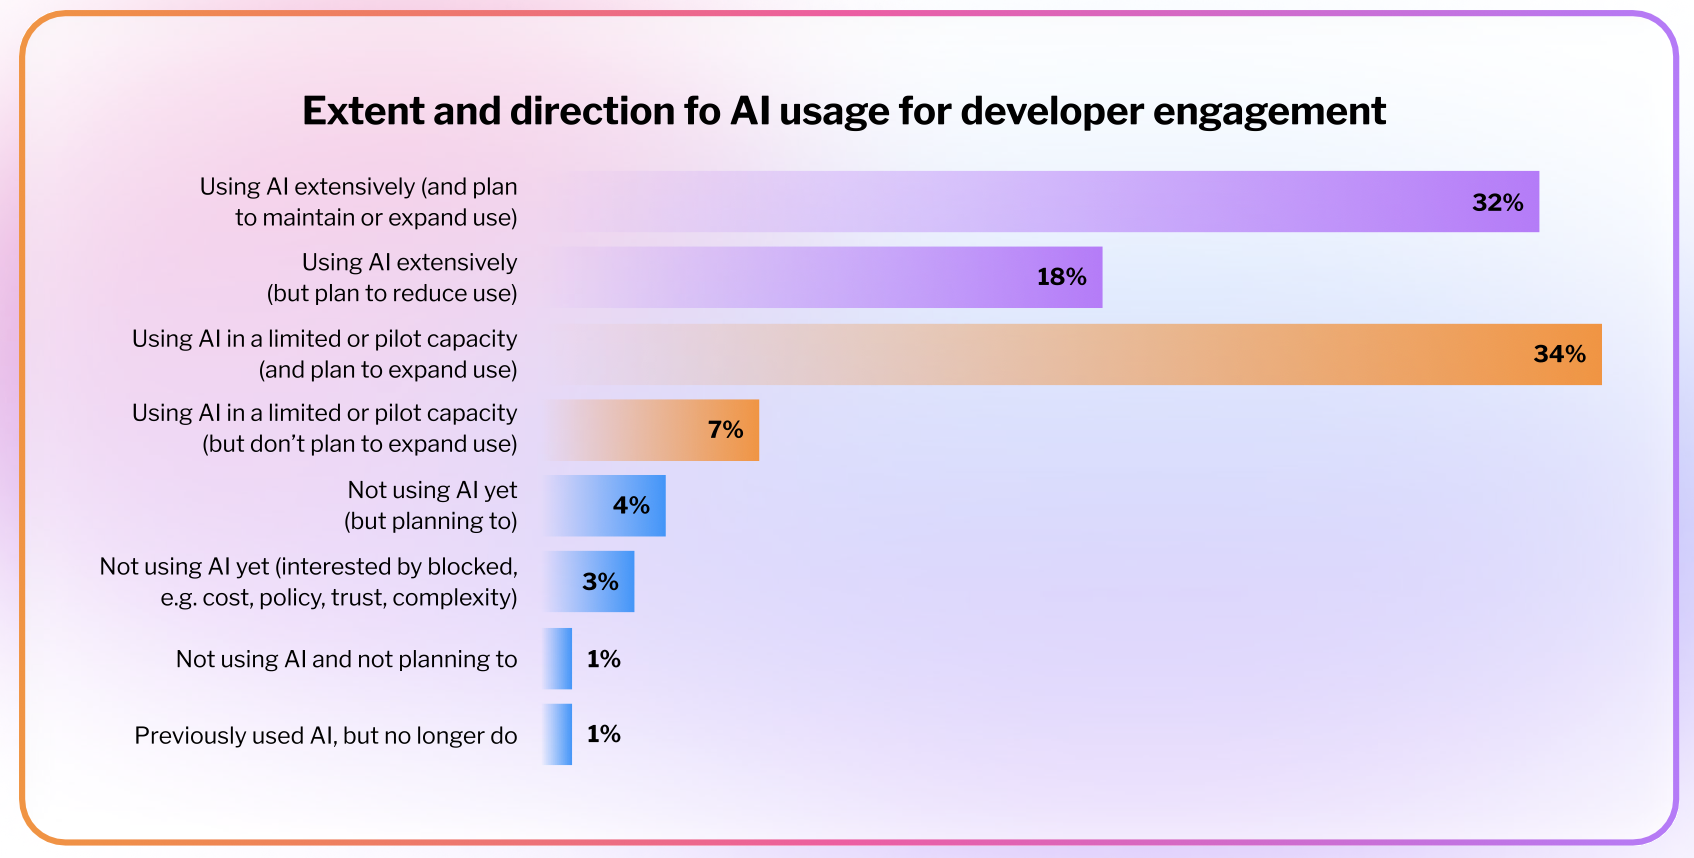
Practitioners were asked to what extent their organizations currently use AI for developer engagement. Adoption is nearly universal. Around nine in ten (91%) report using AI in some capacity, and just 1% say they have no plans to use it. Half (50%) describe their use as extensive, while around two in five (41%) are operating in a limited or pilot capacity, most of whom plan to expand.
Focusing on those practitioners who are currently using AI extensively, we find that 36% (18% of all practitioners) plan to reduce that use. This points to organizations that adopted heavily and are now looking to scale back, likely as actual returns fall short of initial expectations for certain use cases.
This pullback varies sharply by function, though. Among those in sales roles, 86% of those using AI extensively plan to maintain or expand, while just 14% plan to reduce. Marketing (51%) and education (55%) show a very different picture to that of sales practitioners, with only around half planning to maintain or expand extensive AI use. Sales likely sees clearer returns because common use cases, such as lead qualification, outreach, or prospect research, produce measurable, short-cycle outcomes. Marketing and education teams might be applying AI to content and enablement work where AI output might be currently falling short and might be harder to evaluate, and where errors might be less forgiving.
Current and planned AI use cases
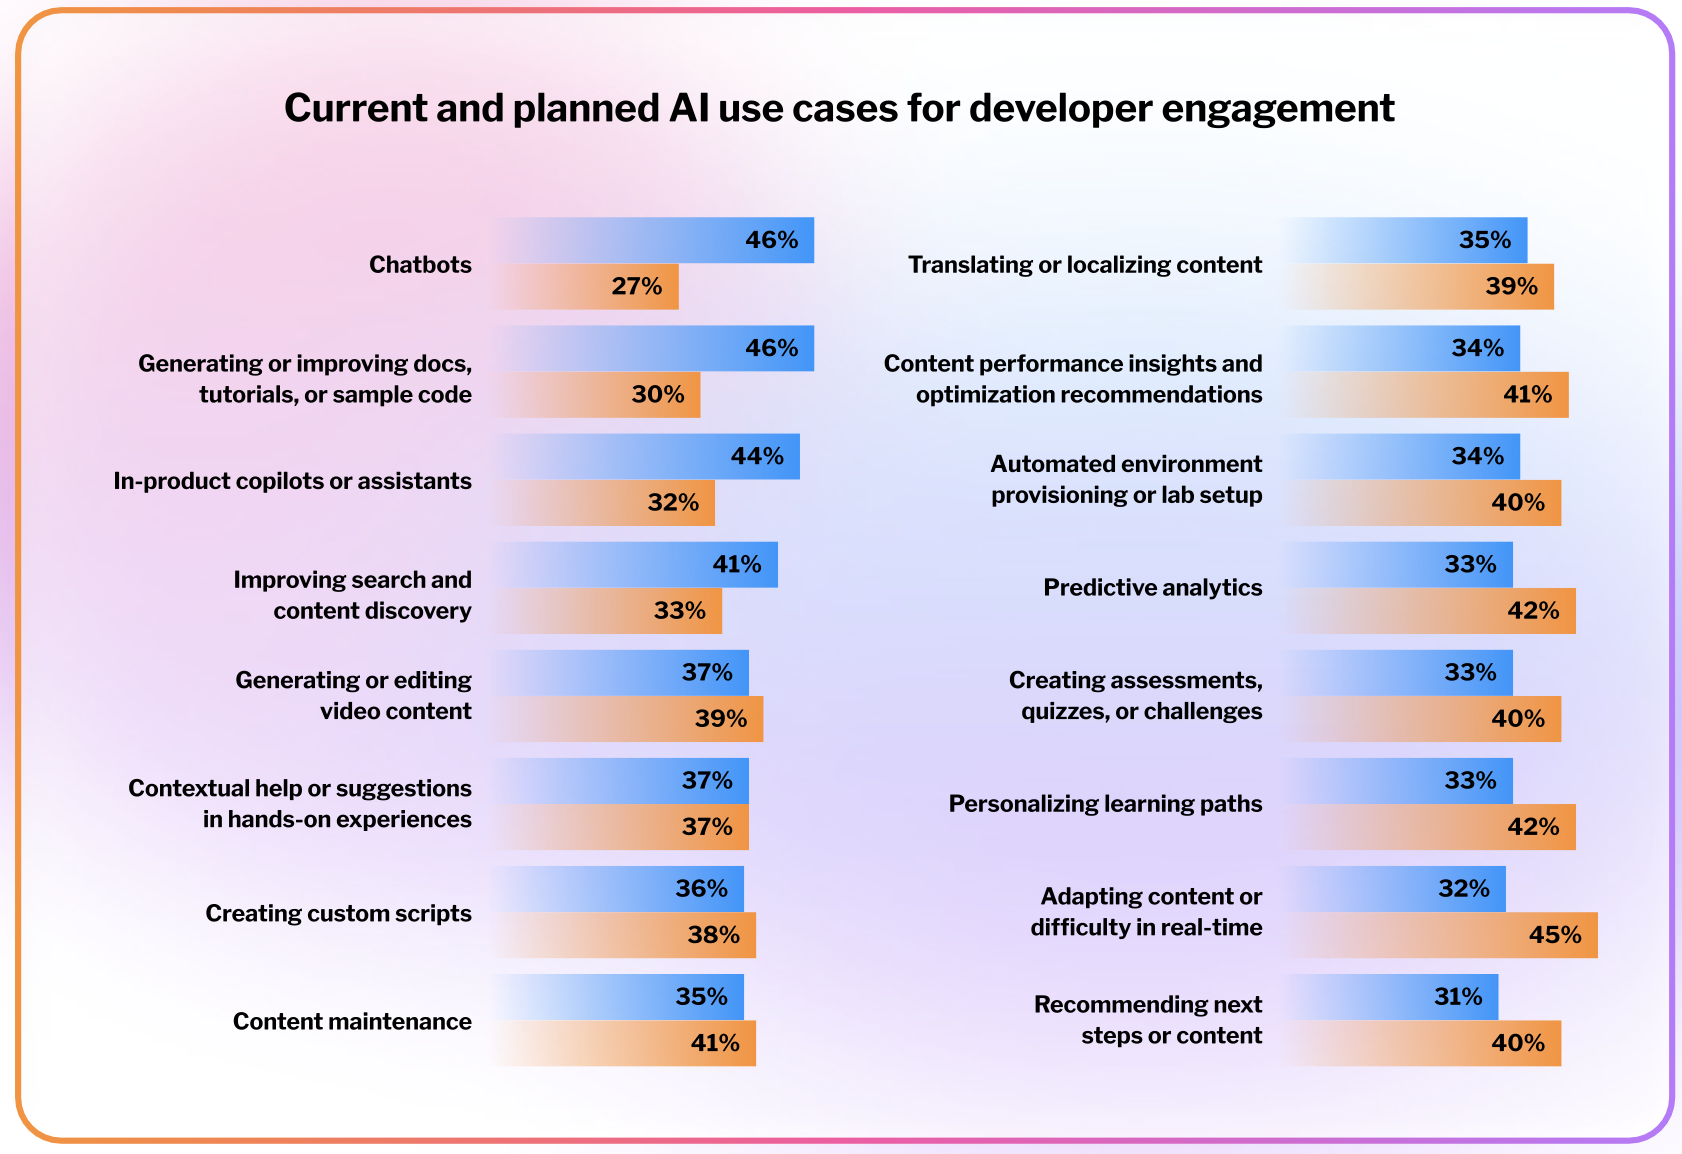
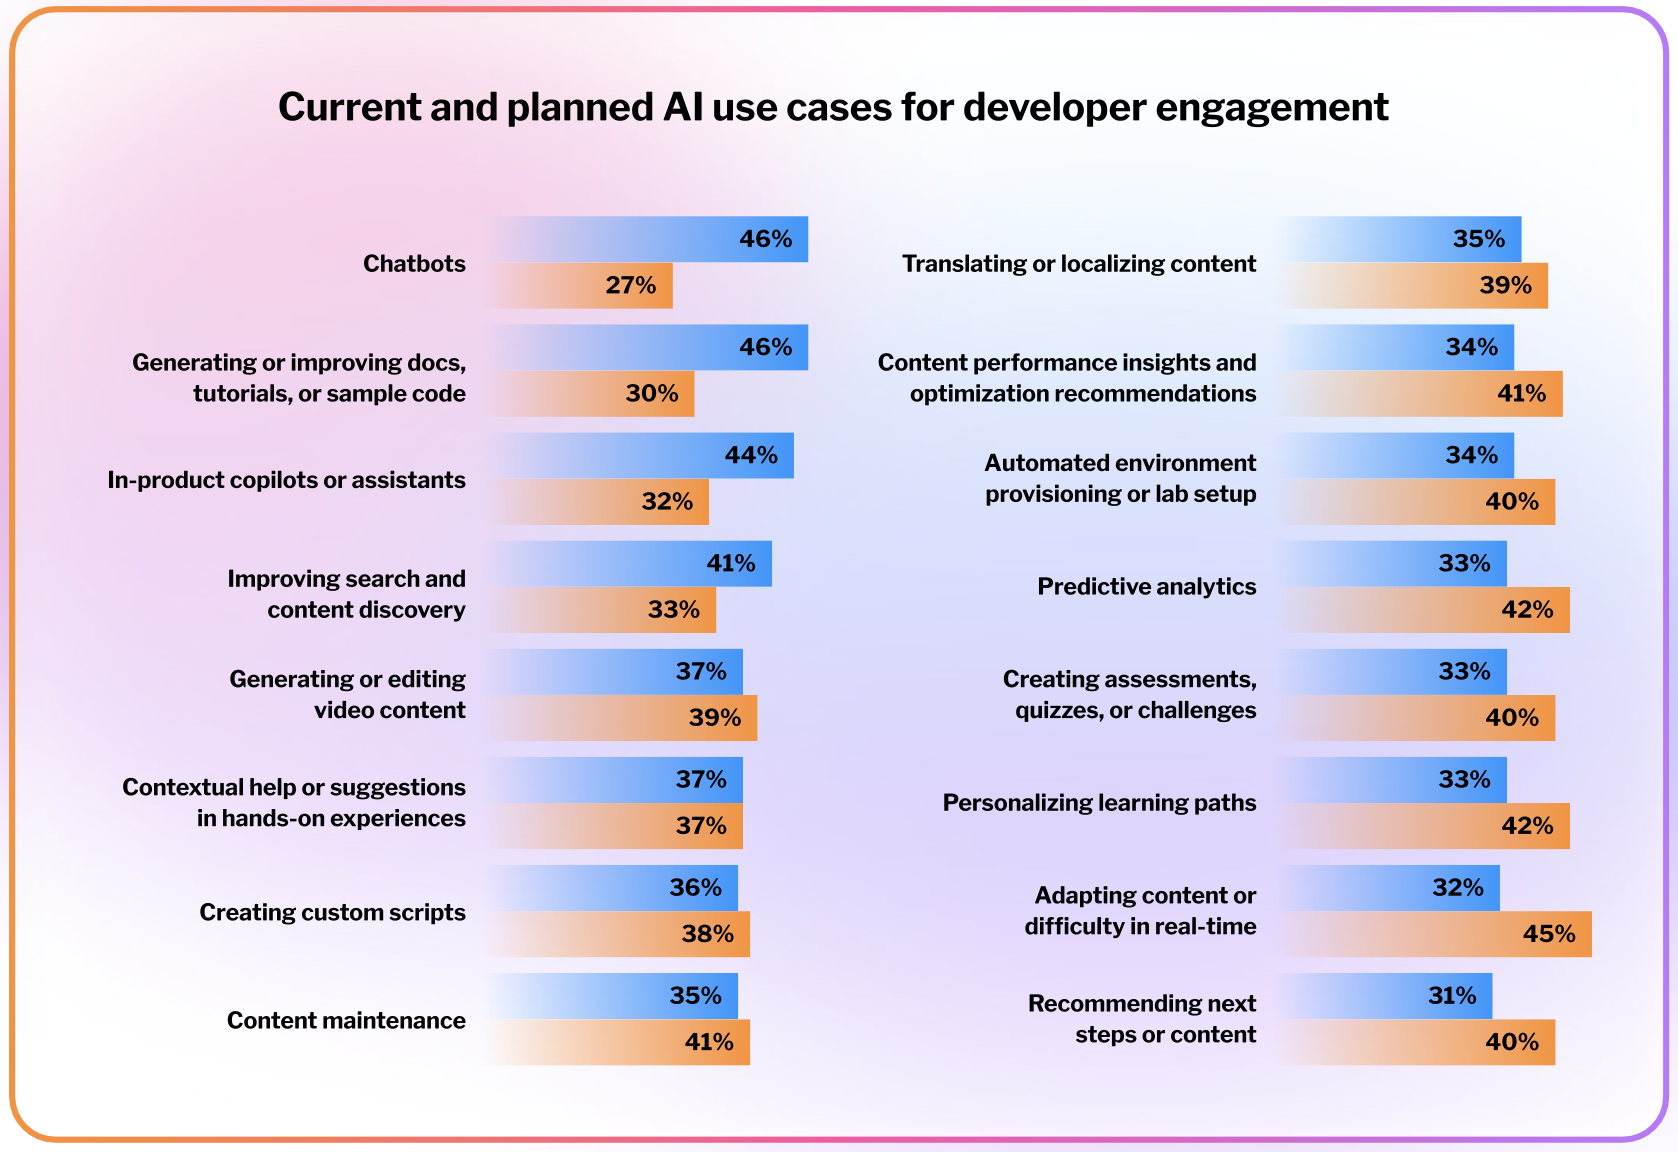
The most common use cases today are chatbots (46%), generating or improving documentation and tutorials (46%), and in-product copilots (44%). Of these, chatbots and in-product copilots are largely reactive, responding to what a developer is doing right now rather than anticipating what they might need next. This signals that AI is still being applied closer to the moment of need than ahead of it.
The more personalization-heavy use cases sit at the bottom of the current usage list. These include recommending next steps or content (31%), adapting content or difficulty in real time (32%), personalizing learning paths (33%), or predictive analytics (33%). However, these same use cases show notably high planned adoption rates (over 40%), suggesting that these applications might be lagging because they are harder to implement, but interest is substantial.
If planned adoption translates into deployment, a shift toward more personalized, adaptive developer engagement is on the horizon. For organizations, this points to both an opportunity and a prerequisite. The infrastructure for personalization (e.g., clean data, connected systems, well-defined learner profiles) needs to be in place before these use cases can deliver on their promise.
Perceived impact of AI
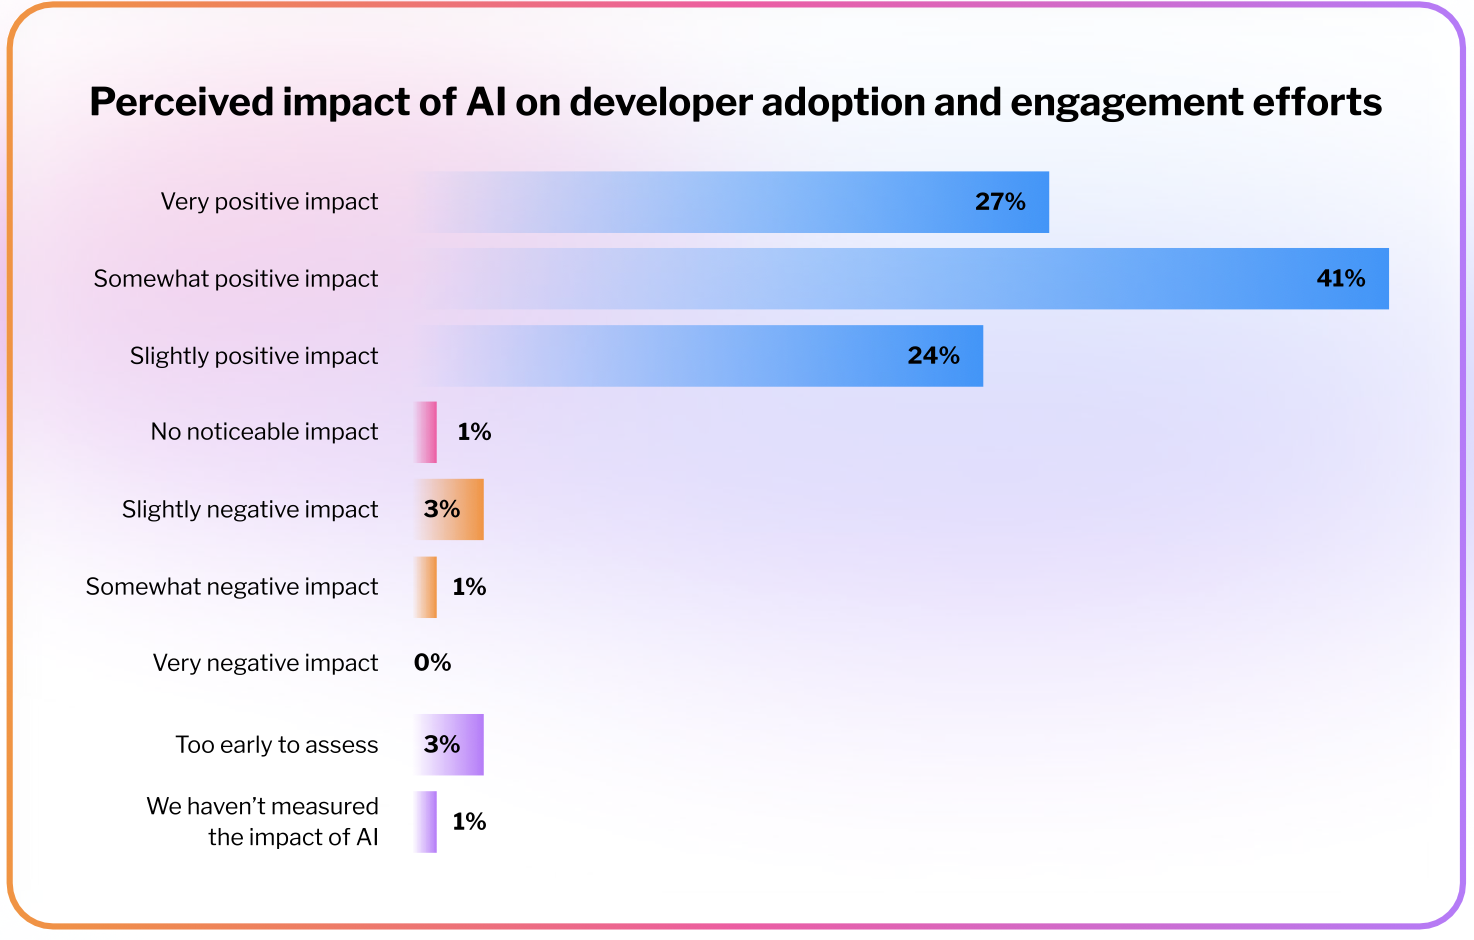
The sentiment among practitioners about the impact of AI is overwhelmingly positive: over two-thirds (68%) report a somewhat (41%) or very (27%) positive impact, and including those reporting a slightly positive impact (24%) brings the total to 91%. Just 4% report any negative effect.
This is also one of the few data points in the report where variables like company size and job function make little difference. Marketing, sales, and education practitioners, who diverge on which practices work and whether to continue using AI to the same extent, broadly agree that AI has had a positive effect on their developer adoption and engagement efforts.
As such, the planned reductions among extensive users, noted earlier in the chapter, should be read in this context. Positive overall sentiment suggests these practitioners are not retreating from AI but consolidating and focusing their use on the applications that deliver measurable value and deprioritizing those where the impact is less clear or AI falls short.
Chapter 5 → The role of community
Most effective community initiatives
Practitioners were also asked, in their experience, which three community initiatives deliver the best results for developer adoption and engagement. Real-time chat communities such as Slack or Discord (29%) top the list, which tracks with the broader effectiveness findings in Chapter 1. Public developer forums (28%), community events or meetups (27%), and beta programs or early access communities (26%) follow closely. The tight spread suggests that different initiatives work in different contexts, depending on the goal, audience, and team structure.
However, the differences sharpen when comparing across job functions. Those in sales rate real-time chat communities (37%), beta programs (34%), and champions or advocate programs (33%) well above their marketing and education counterparts. Sales favors formats that create direct, relationship-driven access to developers, as well as those that build a pool of engaged, technically invested users who can speak for their product to their peers.
Those in education roles lean in a different direction, ranking user-generated content (36%) and public developer forums (31%) as the most effective community initiatives. Both are formats where developers teach and troubleshoot for each other, taking some of the content workload off the education team. Rather than producing everything in-house, education teams can focus on curating what the community creates and filling gaps where peer knowledge falls short. These practitioners are also more likely to favor office hours or AMA (“ask me anything”) sessions (27%). The recurring questions that surface in these sessions can serve as valuable inputs for education and product teams, helping shape documentation, course design, and product strategy around the problems developers are actually encountering.

Peer-to-peer versus structured learning
For different types of developer content, is peer-to-peer delivery or structured learning more effective? Practitioners were asked to evaluate both methods across a range of content types. Structured learning leads in nearly every category, but the margin varies considerably depending on the type of content.
The strongest preference for structured learning appears in content where peer-sourced alternatives add little to no risk. Installation and setup (56% preference for structured vs 21% peer-to-peer) is typically straightforward, with step-by-step guides that need to be accurate and up to date but require little additional context beyond what official documentation already provides. The same proportions can be seen for security and compliance guidance (56% vs 21%) but for a different reason. This is content developers need to trust, and vendors have good reason to keep it centralized. A wrong community recommendation around security or compliance can create vulnerabilities or regulatory exposure. Certification preparation (52% vs 24%) shows a comparable split. Certifications are themselves a structured offering, and it makes sense to pair them with official structured content that maps directly to the syllabus.
Troubleshooting common errors (32% vs 36%) is the only category where peer-to-peer leads, though narrowly. Troubleshooting is inherently contextual: developers often find the most relevant solutions from others who have hit the same problem in a similar environment, and enablement teams seem content to let the community carry that weight rather than trying to document every edge case in-house.
For other, more advanced context-dependent topics, over a third of practitioners rate both methods as equally effective, such as industry-specific use cases (39%), customization (37%), and performance and optimization (35%). For enablement teams, this points to a complementary model: official guidance to establish best practices, paired with peer-to-peer spaces where developers share applied, context-specific knowledge. The most effective strategies are likely to come from connecting the two methods deliberately rather than leaving developers to navigate between them on their own.
Conclusion
This report set out to map how organizations approach developer adoption and engagement today: the practices they use, the challenges they face, how they measure progress, and the role AI and community play.
Documentation and video tutorials form the backbone of developer adoption (widely used and necessary for companies to provide), but practitioners don't rate them as the most effective formats. That distinction goes to community and experiential formats.
The value of hands-on experiences is widely recognized, with practitioners pointing to unique benefits that span the full developer lifecycle, from product evaluation and onboarding to driving usage of advanced features, rather than concentrating at any single stage. Practitioners using hands-on labs also report shorter time-to-productivity than those who don't (63% vs 42% within two months).
Misalignment across teams is the most cited challenge among practitioners, closely followed by the complexity of the technology and the burden of keeping content accurate and up to date. Budget, however, ranks among the least cited challenges. Organizations that get their marketing, sales, and education functions to agree on what works are likely to see better returns than those that simply spend more.
AI use is now nearly universal, and sentiment is broadly positive. Half of practitioners describe their use as extensive, yet over a third of them plan to scale it back. Given that overall satisfaction remains high, this points to a refocusing on the applications that deliver value rather than a retreat from the technology. Today, that value is concentrated in chatbots, in-product copilots, and content generation, while more personalization-heavy use cases sit at the bottom of the list.
When it comes to community, real-time chat communities, public developer forums, and meetups are rated the most effective initiatives, though preferences vary by function. Sales favors formats that build direct relationships, while education leans toward user-generated content and forums. Across content types, structured learning leads where accuracy and trust matter most (e.g., installation, security and compliance guidance, and certification preparation), while peer-to-peer formats prove their worth in context-driven areas like troubleshooting.
Methodology
The findings in this report are based on data collected from an online survey designed, hosted, and fielded by SlashData in March 2026. The survey reached 424 professionals in North America working in marketing, sales, and developer education roles at software companies.
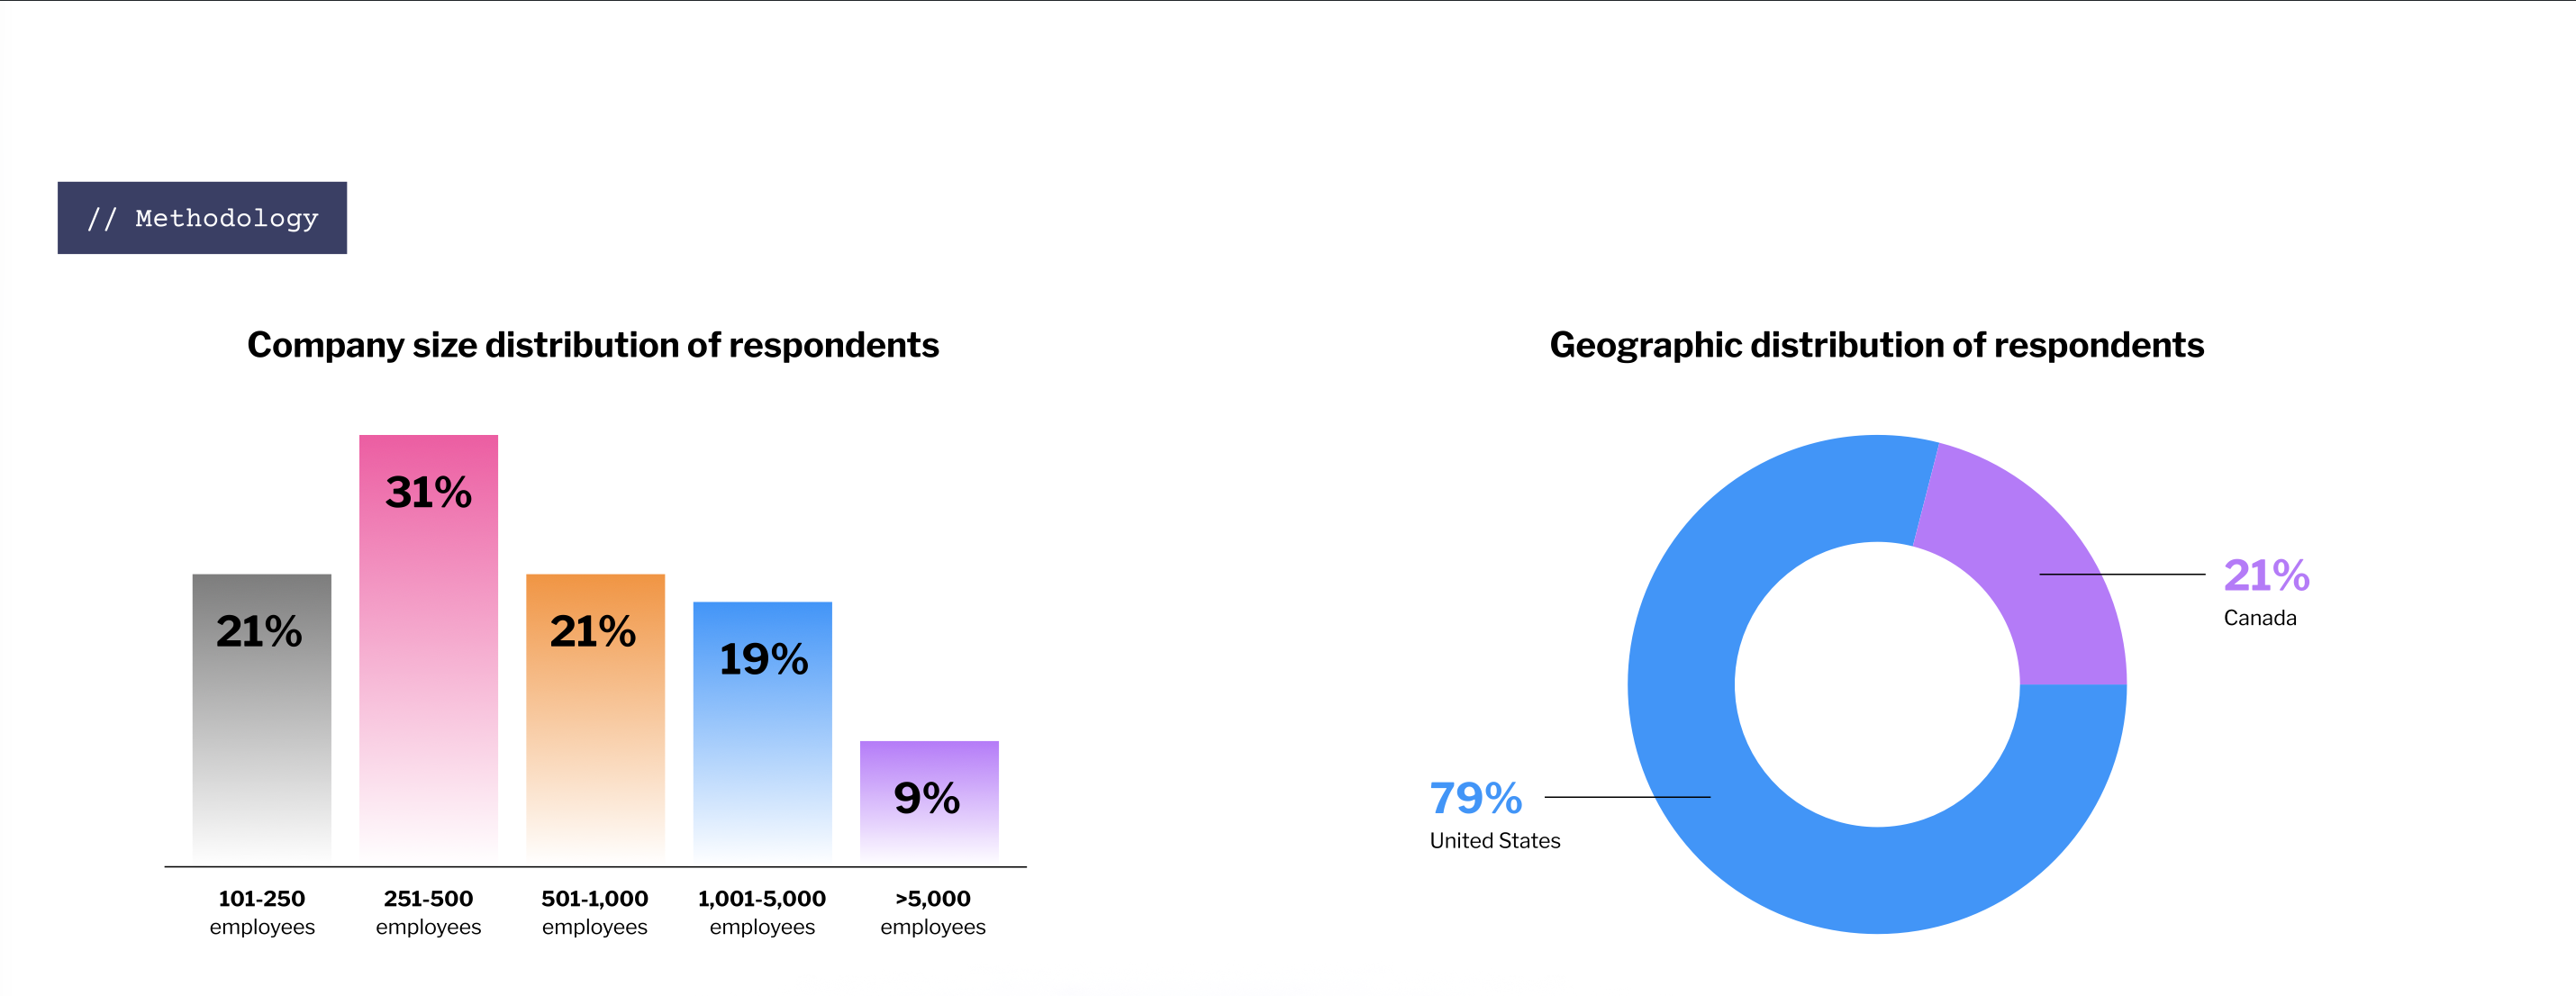
Respondents were screened on several criteria to ensure the sample reflected the target population: geographic location, employment status, job role, the activities they carry out as part of their role, the types of applications their organizations build, and company size.
To minimize selection bias, SlashData partners with multiple panel providers for all research projects. Distributing recruitment across independent sources reduces the risk of any single provider's audience skewing the results.
Data collection ran on SlashData's proprietary survey platform, which captures granular behavioral data at the question level (e.g., response timings, click positions in randomized questions, the extent of the viewport examined in each question, or the setting and unsetting of options) rather than recording only aggregate session-level data.
Data cleansing followed a multi-layered protocol. Standard checks for speeding and straightlining are included, but the process goes further. As part of our suite of more advanced checks, we also have advanced bot detection, including VPN detection, repeated VPN cycling or other unusual network behavior. Consistency checks are also built across related questions throughout the survey.


.jpg)